
Year-on-Year
Documentation
The Year-on-Year screen compares each month's unique visitors with the same
month a year earlier — the truest view of long-term growth and seasonality. Open
it from Traffic → Year-on-Year.
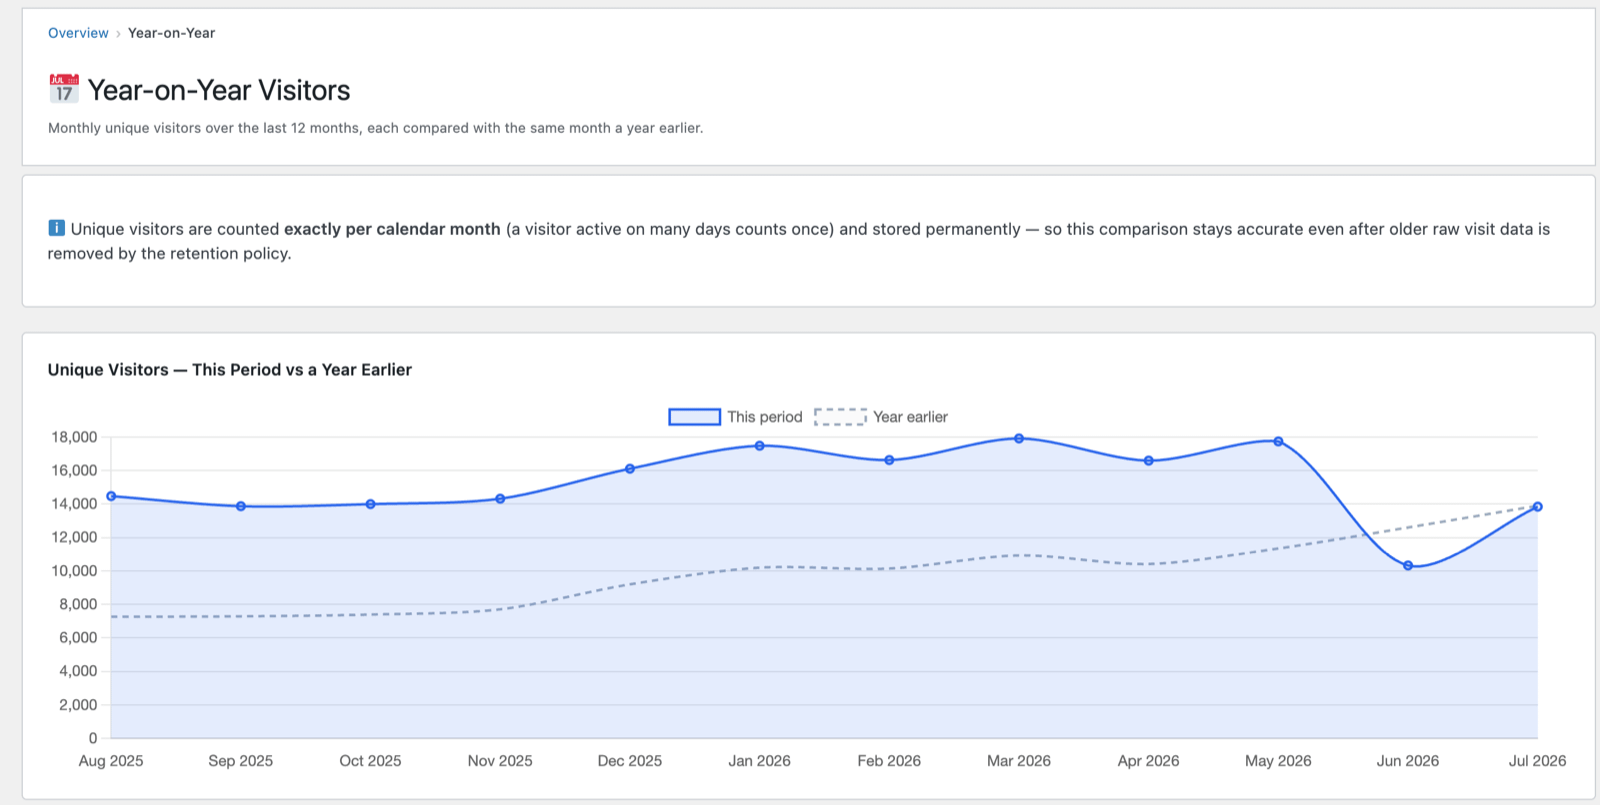
The chart
Unique Visitors — This Period vs a Year Earlier plots the last 12 months as a
solid line, with the previous year overlaid as a dashed line. Where the solid line
sits above the dashed, you've grown vs. the same month last year.
Monthly Breakdown
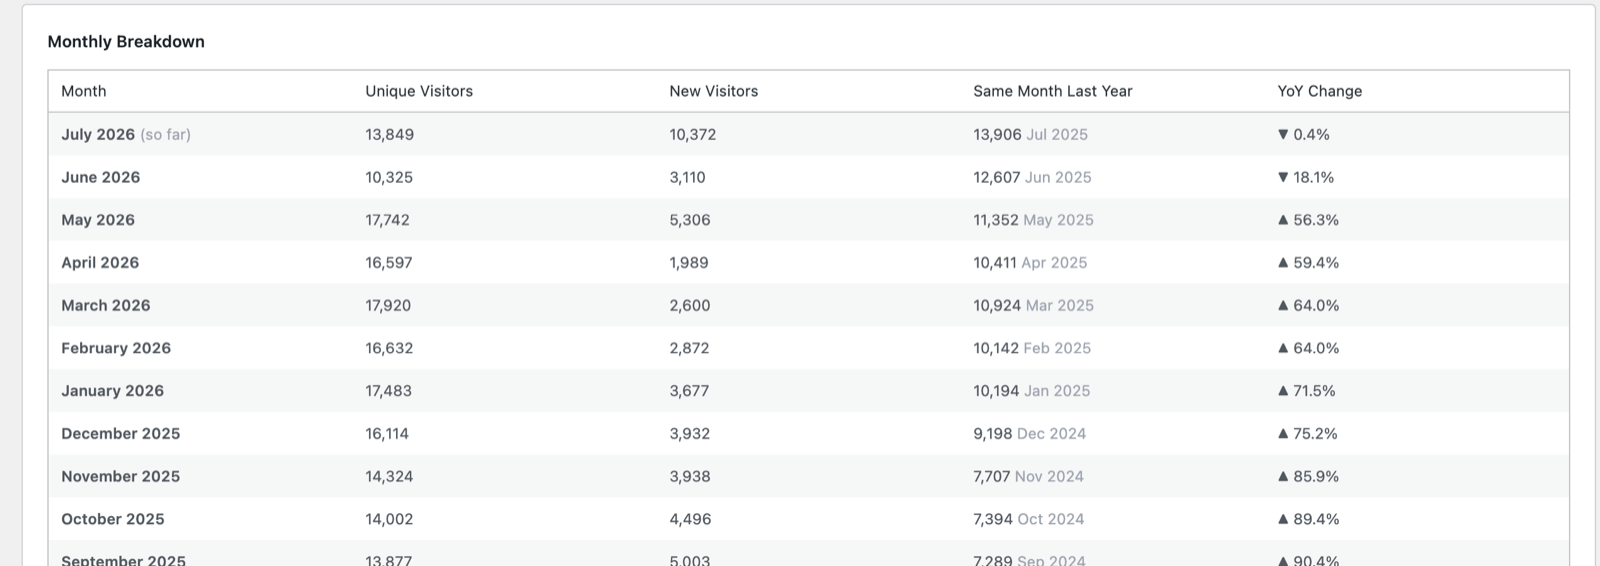
A table with one row per month:
- Unique Visitors and New Visitors for the month.
- Same Month Last Year for direct comparison.
- YoY Change — the percentage up or down.
The current month is marked (so far) since it's still in progress, so a negative
YoY there is expected until the month completes.
Why this survives data pruning
Unique visitors are counted exactly per calendar month (a visitor active on
many days counts once) and stored permanently — so this comparison stays
accurate even after older raw visit data is removed by the retention policy.
This is the key design point: even if you prune raw visit data after, say, 365
days (see Settings & Privacy), your year-on-year history remains
intact because the monthly unique-visitor totals are rolled up and kept
permanently. The same applies to WooCommerce revenue roll-ups, so sales YoY
survives pruning too.
Next: Ask AI →