
Overview dashboard
Documentation
The Overview is your home base — a single screen answering "what's happening on my
site right now?" Open it from GreenOrb Statistics → Overview.
▶ Watch the video: GreenOrb Statistics dashboard tour (3:14)

Top bar
- Tabs (Overview · Traffic · Audience · Content · WooCommerce · Admin) jump to
every part of the plugin. - 🟢 live shows how many visitors are on your site right now.
- PDF exports the current dashboard as a PDF for sharing or archiving.
- ⚙ Customize Layout lets you show, hide and reorder the panels below; your
arrangement is remembered.
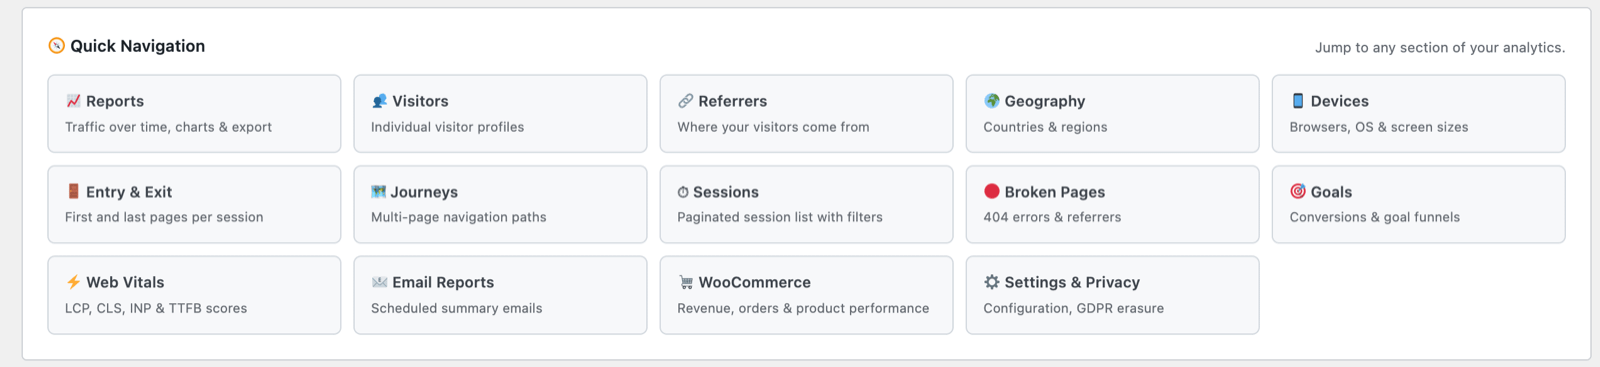
Quick Navigation
A grid of shortcut cards to every report — Reports, Visitors, Referrers, Geography,
Devices, Entry & Exit, Journeys, Sessions, Broken Pages, Goals, Web Vitals, Email
Reports, WooCommerce and Settings & Privacy. A fast way to reach any section.
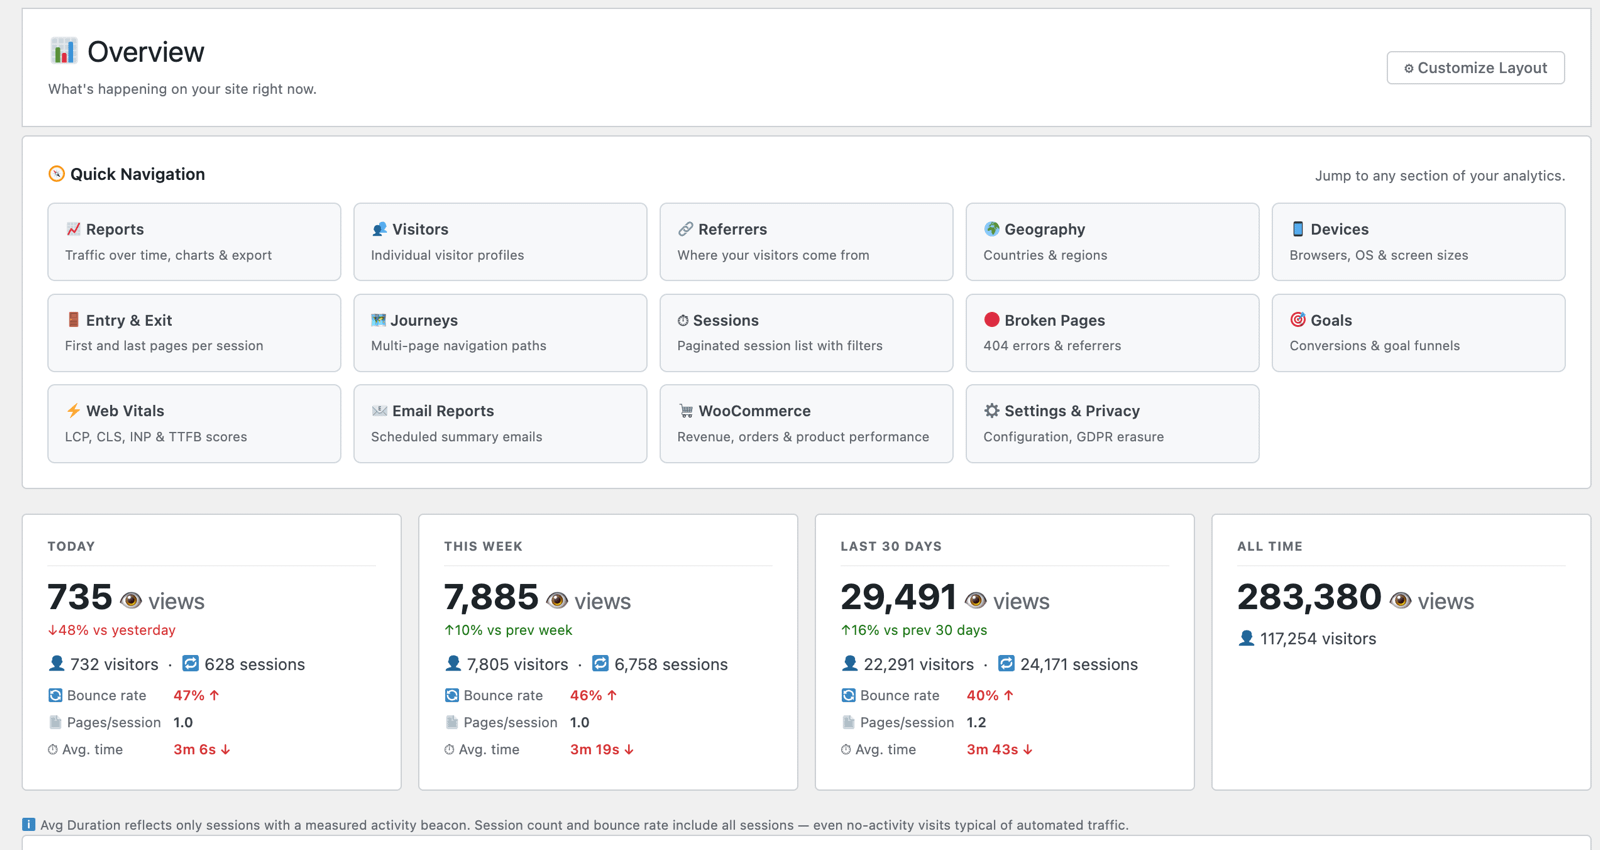
The four headline cards
Each card summarises a period and trends it against the previous one:
| Card | Shows |
|---|---|
| Today | Views, visitors, sessions and average time so far today (a partial, in-progress day), with change vs. yesterday. |
| This Week | The last 7 days, vs. the previous week. |
| Last 30 Days | The last 30 days, vs. the previous 30. |
| All Time | Cumulative views and visitors since tracking began. |
Within each card you'll also see bounce rate, pages / session and
average time (engaged time — see Understanding your metrics).
Note shown under the cards: "Avg. time reflects only sessions with a
measured activity beacon. Session count and bounce rate include all sessions —
even no-activity visits typical of automated traffic." This is deliberate: it
keeps your engagement averages honest while still counting every visit in your
totals.
Traffic Trend
A chart of page views over the selected period (30 days by default). Use Full
traffic report → to open the detailed Reports screen with
per-day breakdowns, unique visitors and CSV export.

The dashboard panels
Below the headline cards and the Traffic Trend chart, the Overview is a stack of
self-contained panels. Two update in real time; the rest are fixed last-30-day
summaries that give you the shape of your traffic at a glance, each linking through
to its full report. Every panel here can be reordered, resized or hidden with
⚙ Customize Layout — only the Period Summary cards and the Traffic Chart are
locked in place.
Live panels (refresh automatically every 30 seconds)
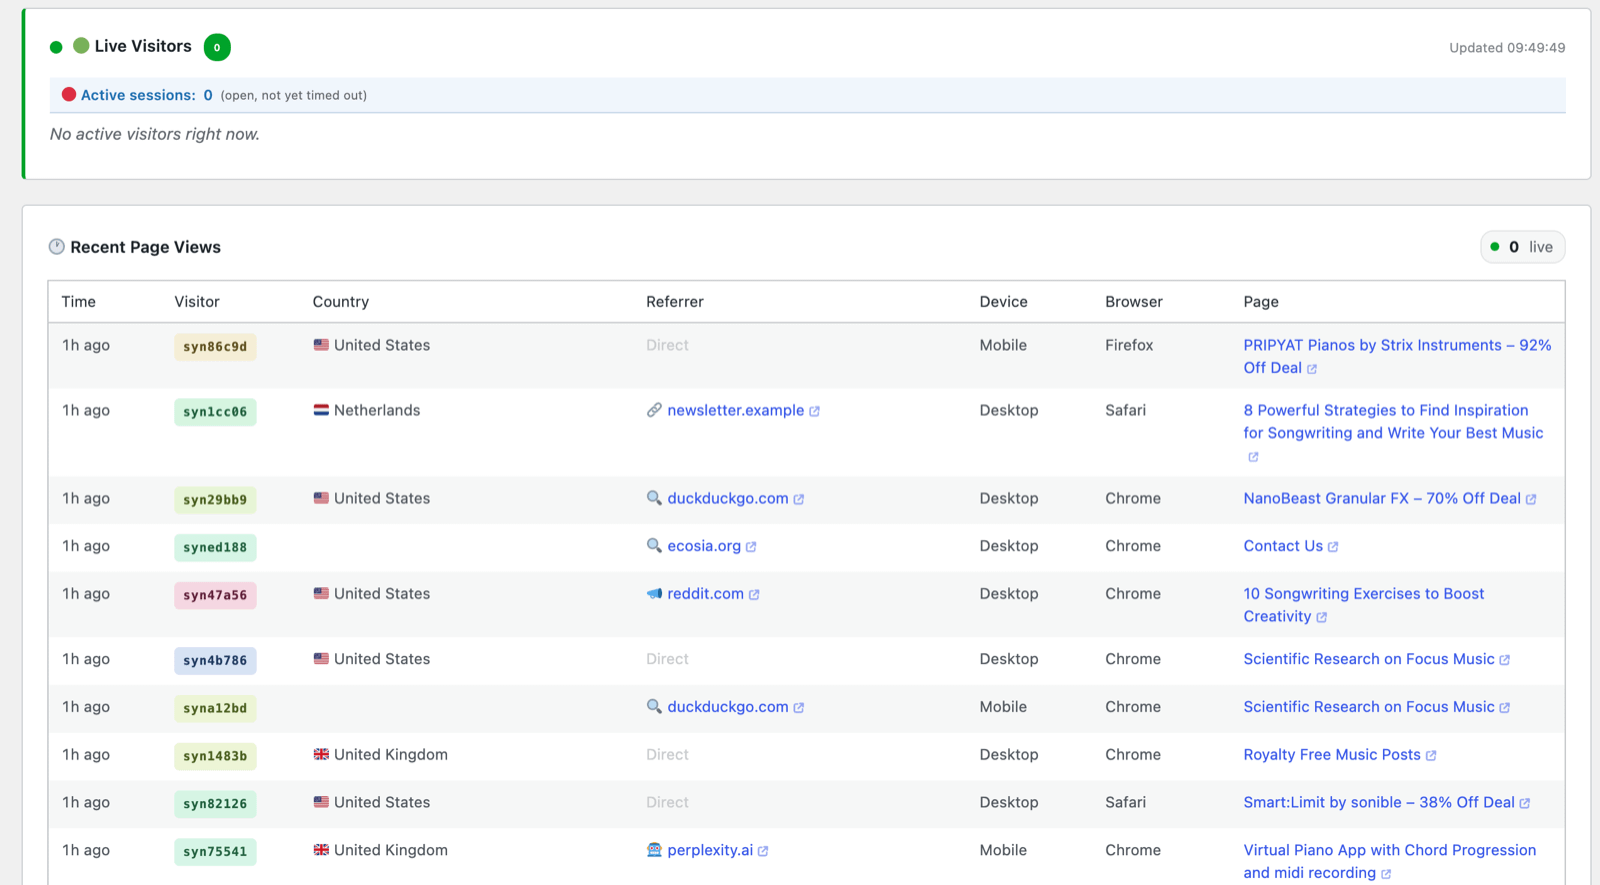
- 🟢 Live Visitors — who is on your site right now. A count badge shows how
many visitors are currently active, and an Active sessions line shows how
many sessions are still open (not yet timed out). The table lists each live
visitor's current page, pages viewed this session, device, location and referrer. - 🕐 Recent Page Views — a rolling log of the most recent individual page views,
newest first, with a small live counter (visitors active in the last 5
minutes). Columns: Time, Visitor, Country, Referrer, Device, Browser and Page.
The Visitor chip opens that visitor's full profile and the Page links to
the live post. Usually the quickest way to eyeball whether incoming traffic looks
genuine.
Last-30-day summary panels
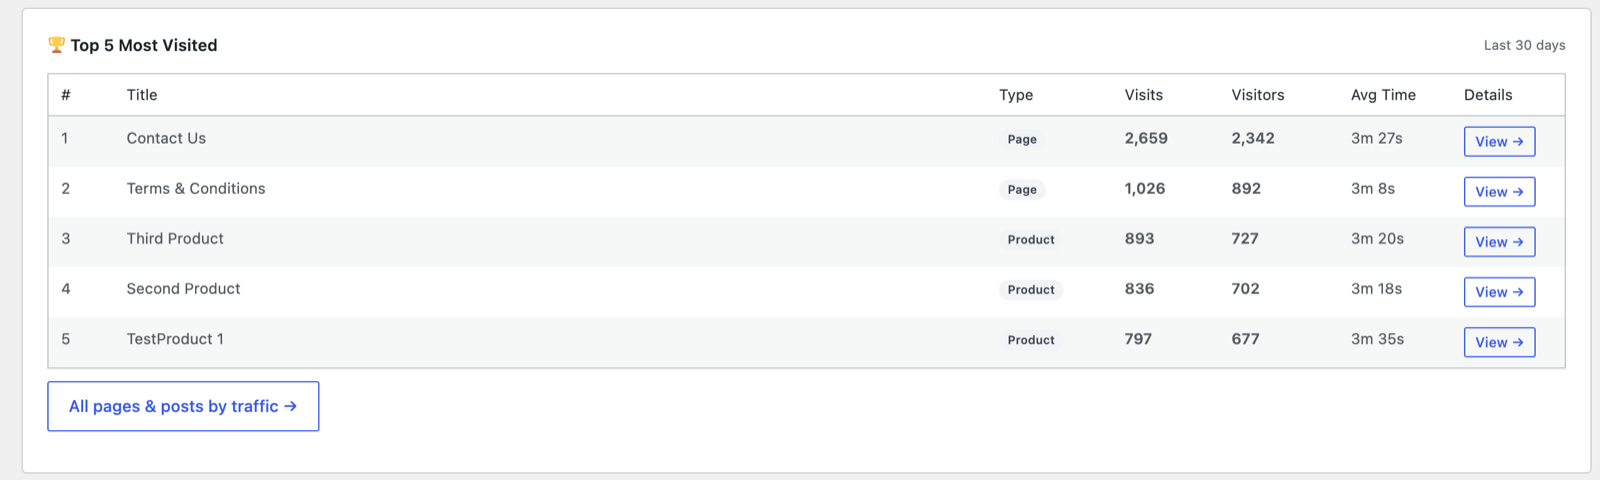
- 🏆 Top Content ("Top 5 Most Visited") — your five busiest posts and pages,
each with its type, visits, unique visitors and average engaged time, plus a
View → to the per-post detail. Links onward to the full ranking. - 🔗 Referrers ("Top 5 Referrers") — the five sites sending you the most
traffic, with each source's channel type (search, social, AI, other), visits and
visitors. The source name links out to the referring site. (Hidden when there are
no referrers yet.) - 🌍 Top Countries ("Top 5 Countries") — where your visitors are, by visits and
unique visitors, with flags. If geolocation isn't set up it prompts you to install
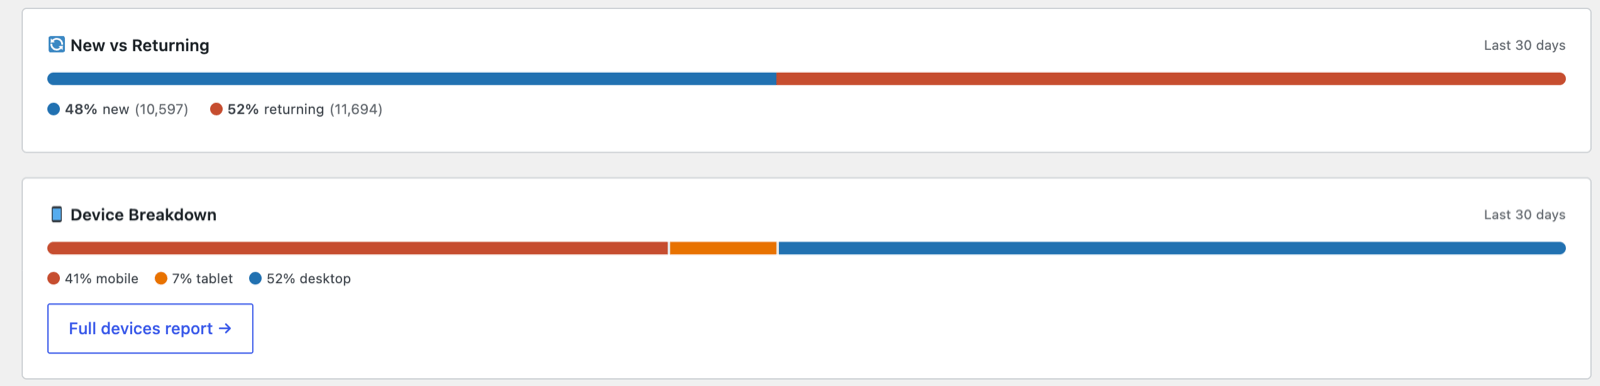
a database in Settings. Links to the full Geography report. - 🔄 New vs Returning — a split bar showing what share of this month's visitors
are first-timers versus returning, with the exact counts. - 📱 Device Breakdown — a stacked bar splitting visitors across mobile, tablet
and desktop, with percentages and a link to the full Devices
report. - 🎵 Media & Downloads ("Top 5 Tracks & Downloads") — your five most-engaged
media items (SoundCloud/YouTube plays and file downloads), each with its type,
visits and visitors. (Hidden when no media events have been recorded, so
non-media sites won't see it.) - 💡 Engagement Snapshot — two quality-of-engagement readouts for the month:
Media Conversion (the share of sessions that included a play or a download)
and Visitor Loyalty (active visitors split into New, Returning and Loyal,
where loyal means 5 or more lifetime sessions). Appears once there's engagement
data to show.

Two things to know: the summary panels are fixed 30-day windows — a dashboard
snapshot, not driven by a date picker — and Live Visitors and Recent Page
Views are the only panels that update on their own.
Everything links onward
The Overview isn't just a display — it's the plugin's best jumping-off point:
- Visitor chips are clickable. In the recent-activity panel, every coloured
visitor chip (e.g.a1b2c3d4) opens that visitor's full profile — every
visit, session and journey tied to that one pseudonymous signature (a
rotating hash, not a name or a person). Spot an interesting visit, click, and
you see the whole story around it. - Article titles open the live page on your site (new tab), so you can see
exactly what the visitor saw. - Stat cards and Quick Navigation cards link through to their full reports —
the Today card leads to today's traffic, the WooCommerce card to revenue, and
so on. - Wherever you land, the breadcrumbs at the top walk you back.
Tips
- The Today card's lower numbers are normal — it's only counting up to the current
moment, not a full day. - Use Customize Layout to push the panels you care about (e.g. WooCommerce
revenue) to the top.