
At a glance: outside the plugin's menu
Documentation
Most of this guide covers GreenOrb's own reports. But three of its surfaces live
outside the GreenOrb Statistics menu entirely — they bring the numbers to you
while you're doing something else:
| Surface | Where it appears |
|---|---|
| Traffic Summary widget | Your main WordPress Dashboard (wp-admin home) |
| Post stats box | The side column of the post editor |
| Admin bar live stats | The WordPress toolbar, on the front-end and in wp-admin |
All three respect the same permissions as the reports — only users who can view
GreenOrb statistics ever see them — and all three are read-only shortcuts into the
full reports.
The Dashboard widget
On your main WordPress Dashboard, GreenOrb adds a 📊 GreenOrb Statistics — Traffic
Summary widget. It's the fastest health check there is: you get it just by
logging in.
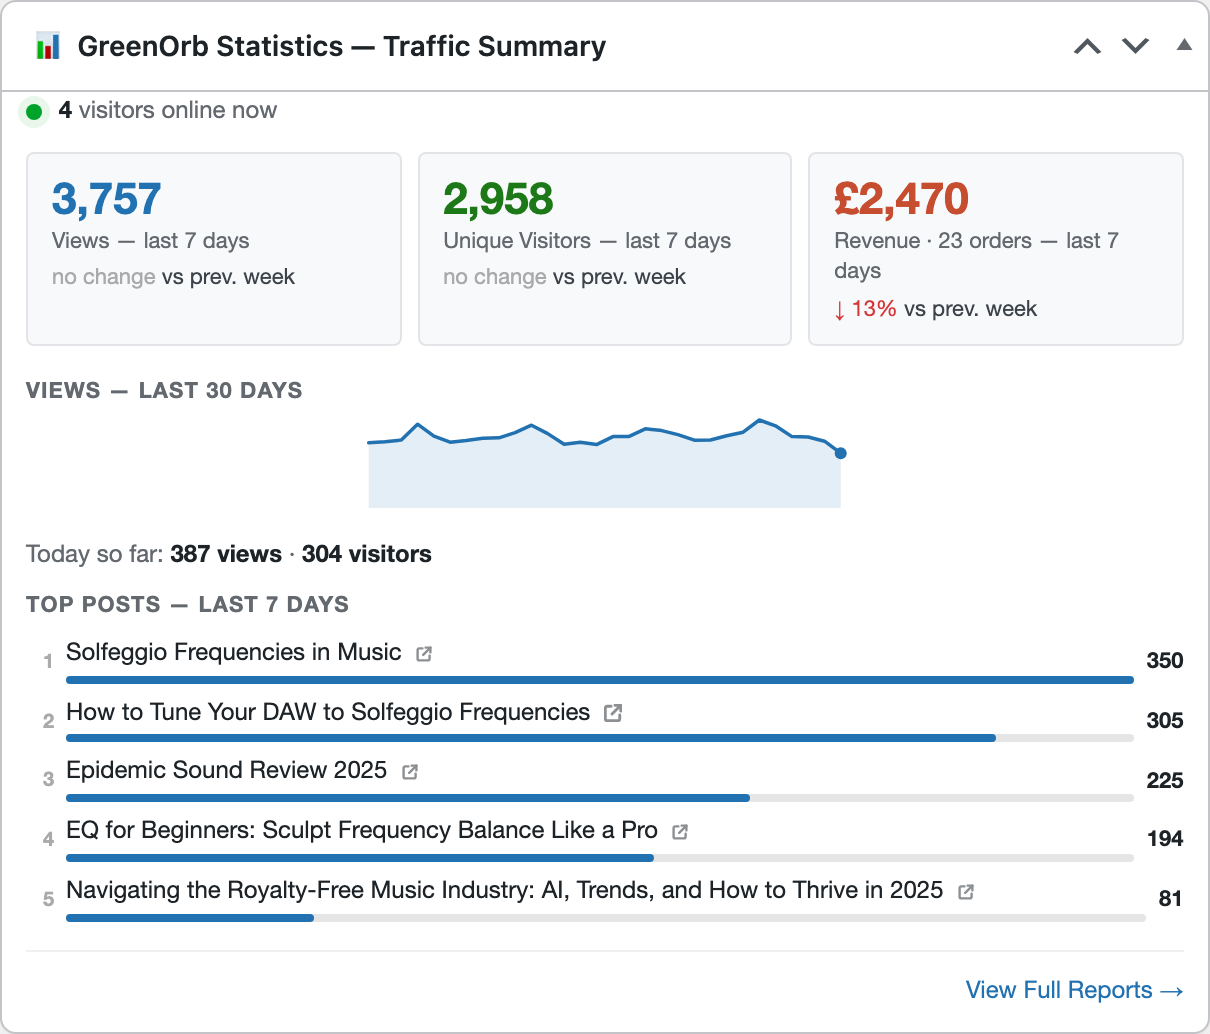
From top to bottom:
- 🟢 N visitors online now — a live count of visitors active in the last
five minutes. Every "online now" figure in the plugin — this widget, the
admin bar and the Overview's Live panel — uses the same five-minute measure,
so they always agree. - Stat cards — last 7 days, each with a trend against the previous week:
- Views and Unique Visitors.
- Revenue — plus the order count, e.g. "Revenue · 12 orders". This third
card only appears when WooCommerce is active.
- Views — last 30 days — a sparkline, so you can see the momentum behind
the 7-day headline rather than just a single number. - Today so far: N views · M visitors — the day in progress.
- Top Posts — Last 7 Days — your five best performers, ranked, each with a
relative bar and a link to the live page.
The widget is a standard WordPress dashboard widget, so you can drag it around
or hide it entirely from Screen Options at the top of the Dashboard.
The post stats box
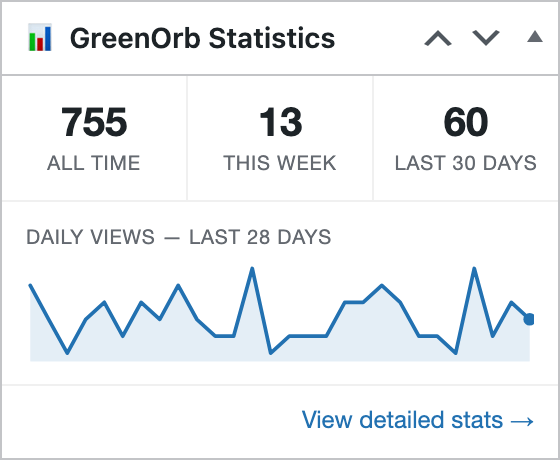
Open a post for editing and GreenOrb adds a 📊 GreenOrb Statistics box to the side
column, so you can see how a piece performed without leaving the editor:
- All time, This week and Last 30 days view counts, side by side.
- Daily views — last 28 days — a sparkline of the post's own trend.
- View detailed stats → — opens that post's full
detail report (its own traffic trend, sources and visitor
list).
On a draft or a brand-new post you'll see "Stats will appear once this post is
published" instead — there's simply nothing to report yet. The box appears on
posts; the sparkline is hidden until the post has at least one view.
Tip: this pairs well with updating older content. Open an ageing post, and
the 28-day sparkline immediately tells you whether it's still earning its place
or quietly fading.
Admin bar live stats
The most persistent surface: a live node in the WordPress toolbar, visible on
both your site's front-end and inside wp-admin.
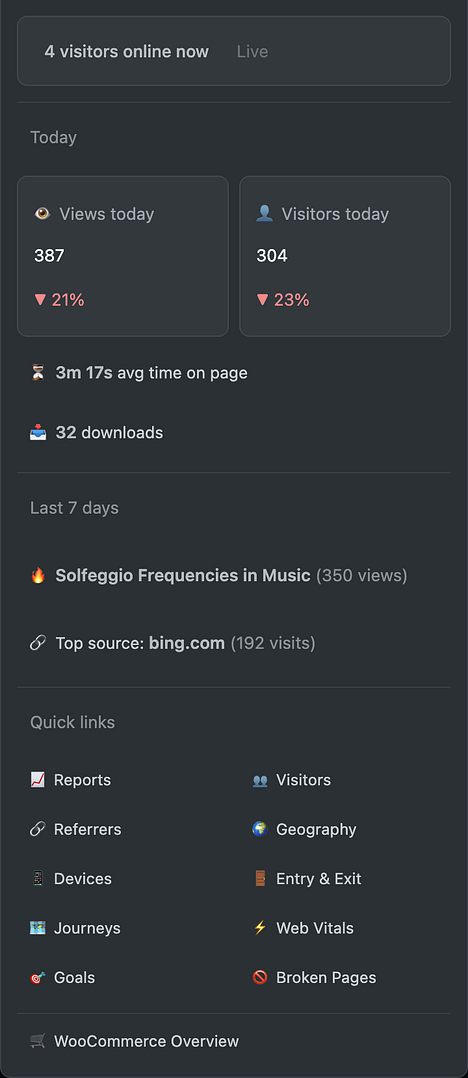
In the bar itself you get today's view count and a live online count, with a
dot that pulses green when someone is on the site and sits grey when nobody is.
Clicking it opens Reports. The online count refreshes itself
every 60 seconds — no page reload needed.
Open the dropdown and you get five sections:
- Live — a banner with "N visitors online now".
- Today — Views and Visitors tiles, each with a ▲/▼ percentage
against yesterday. Below them, avg time on page, downloads and goal
conversions — each of these three only appears when there's something to
show, so the menu stays short on a quiet day. - This page — appears when you're viewing a post on the front-end or
editing one in wp-admin. Shows the post's title, its all-time and today
views, the average time on it today, and a View full post report → link.
This is the quickest route from "I'm reading this article" to "how is this
article doing?". - Last 7 days — your 🔥 top post and 🔗 top traffic source for the
week, each with its count. - Quick links — a two-column set of shortcuts to Reports, Visitors,
Referrers, Geography, Devices, Entry & Exit, Journeys, Web Vitals, Goals and
Broken Pages, plus WooCommerce Overview when WooCommerce is active. A link
for a feature you've switched off is greyed out but still clickable —
opening it lands on the friendly "this feature is turned off" screen so you can
re-enable it.
You can turn the whole thing off with the Admin bar setting under
Settings & Privacy — useful if you'd rather keep your toolbar
clean, or you're taking screenshots of your own site.
That's the full tour. Back to the documentation index.