
Open any analytics dashboard, and you will find a number labelled Sessions. It sits there with the quiet confidence of a hard fact.
But it is not a fact. It is a reconstruction. It is your analytics tool’s best guess at something it never actually saw.
That is true of every analytics platform, including ours. What separates a trustworthy sessions number from a flattering one is how good that guess is, and whether the tool is willing to show you its workings.
Every session in website analytics is built from four inferences. The traditional approach gets some of them badly wrong, and GreenOrb Statistics makes them differently.
1. The Short Definition: What a Session in Website Analytics Actually Is
At its core, a session is one continuous browsing visit. It encompasses everything a single person does on your site in one sitting, from the page they arrive on to the point they stop.
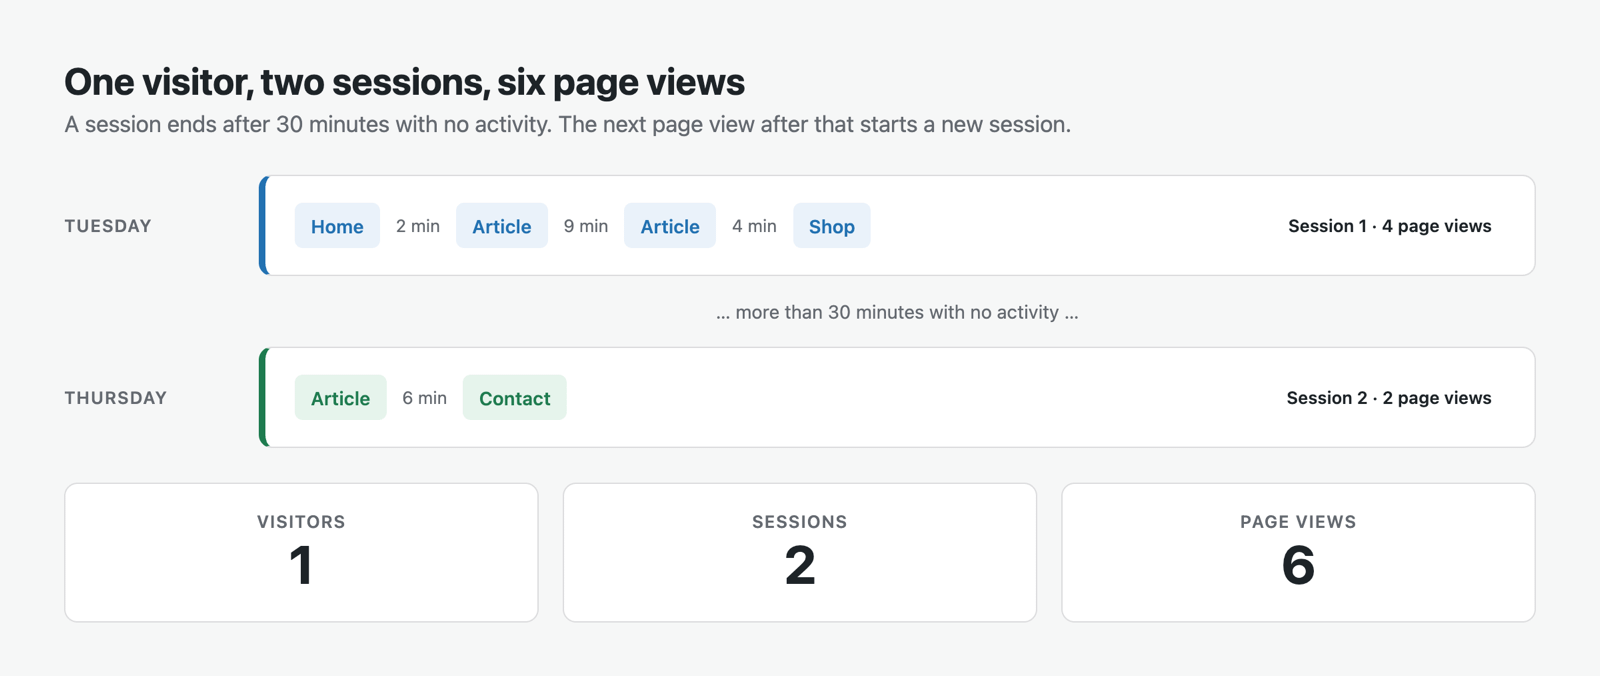
The standard convention, commonly inherited from the early web and still near-universal across the industry, is that a session ends after 30 minutes of inactivity. If a visitor returns 31 minutes later, that counts as a new session. GreenOrb Statistics uses this exact 30-minute window. A metric that disagrees with every other tool about something this basic isn’t useful to anyone.
A session is not a person, and it is not a page view. One reader who visits on Tuesday and again on Thursday is one visitor, two sessions, and potentially six page views. Sessions are the unit that answers the question: “How many separate visits did my site receive?”

2. The Four Inferences: Why Session Data Is a Guess
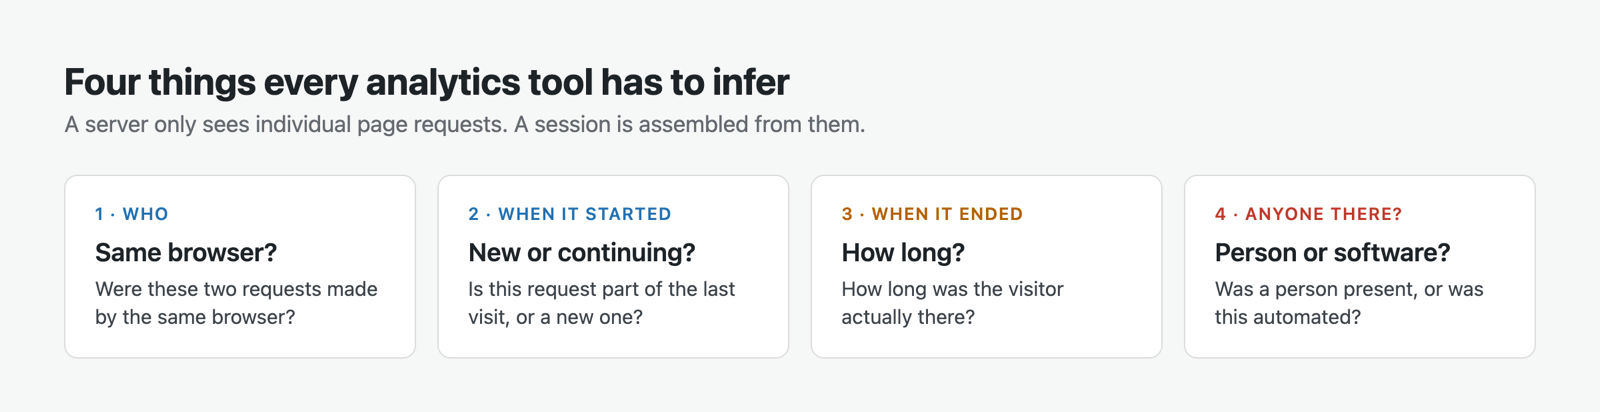
Your server never actually sees a “visit.” It only sees a scatter of individual HTTP requests. To turn those raw requests into a coherent session, every analytics tool must infer four separate things:
- Who: Were these two requests made by the same browser?
- When it started: Is this request part of the previous visit, or a brand new one?
- When it ended: How long was the visitor actually there?
- Whether anyone was there at all: Or was this just automated software?
Each inference can be made well or poorly, and the errors compound. If a tool gets the last two wrong, your bounce rate, average session duration, and engagement figures are all built on sand. Unfortunately, this is the exact situation on a great many WordPress sites right now.
3. The Zero-Second Last Page: A Widespread Blind Spot
The zero-second last page is one of the biggest sources of error in traditional web analytics.
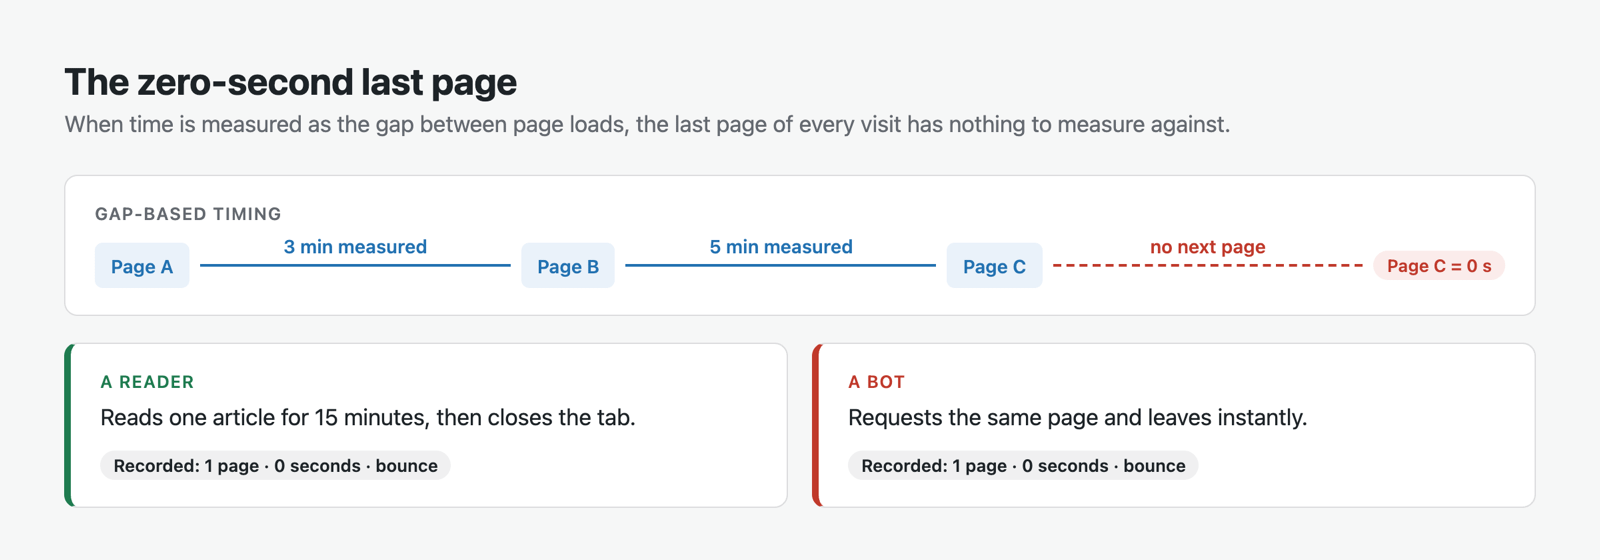
If a tool measures time by looking at the gap between page loads, it can only measure a page after the visitor leaves it for another page on your site. This means the last page of every single visit is recorded as zero seconds. There is no next page to measure against.
Follow that logic through:
- A human lands on your article, reads it attentively for fifteen minutes, and closes the tab. Recorded: one page, zero seconds.
- A bot touches the same page and vanishes instantly. Recorded: one page, zero seconds.
Under the traditional rule, where one page view equals a bounce, those two visits are completely indistinguishable. Both count against you. Because single-page visits make up the majority of traffic on most content, media, and music sites, this is not a rounding error. It is a systematic misrepresentation of your best readers, artificially dragging your bounce rate up and your average time down.
This is structural. It comes from measuring time by subtraction, not from a bug in anyone’s code.
4. The GreenOrb Approach: Three Independent Axes of Truth
GreenOrb Statistics qualifies every session on three independent axes. These are the actual rules and numbers.
Axis 1: Engagement has a definition you can read
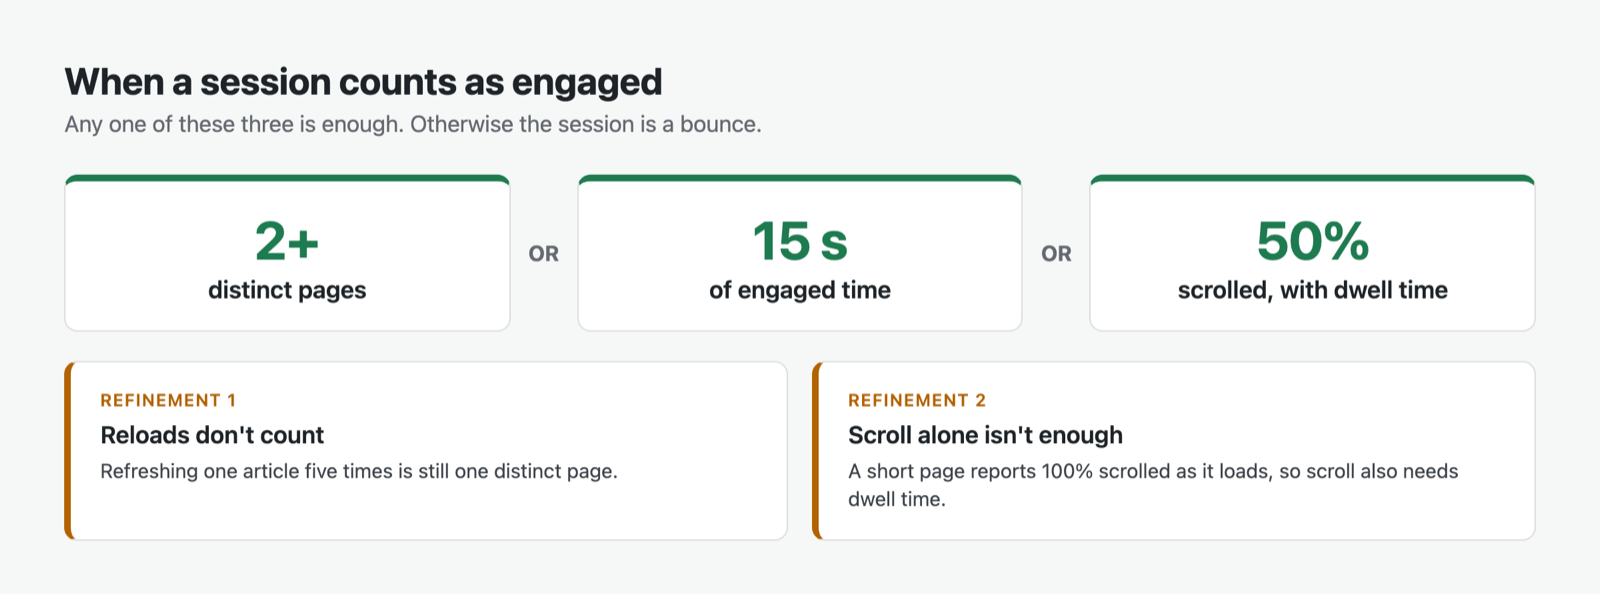
A session is marked as Engaged if any one of these is true:
- The visitor viewed 2 or more distinct pages.
- They accumulated 15 seconds or more of real engaged time.
- They scrolled at least 50% down a page and spent real time on it.
Two refinements apply:
- Reloads do not rescue a bounce. The page test counts distinct pages. Hitting refresh five times on one article is still a bounce.
- Scrolling alone is not enough. A short page reports 100% scrolled the instant it loads, so the scroll rule also needs real dwell time. Otherwise an instant bounce would count as engagement.
5. Axis 2: Real Time vs. Gap Time: Measuring What Actually Matters
GreenOrb measures engaged time directly in the browser, not by subtraction. This means the last page of a visit is fully measurable. It counts only time the page is actually visible:
- The clock pauses when the tab is hidden or the browser is minimised.
- It stops about a minute after the last interaction, so a tab left open over lunch stops accruing “reading time.”
- It keeps running while embedded media is playing. Someone listening to a four-minute track is engaged, even if they aren’t touching their mouse.
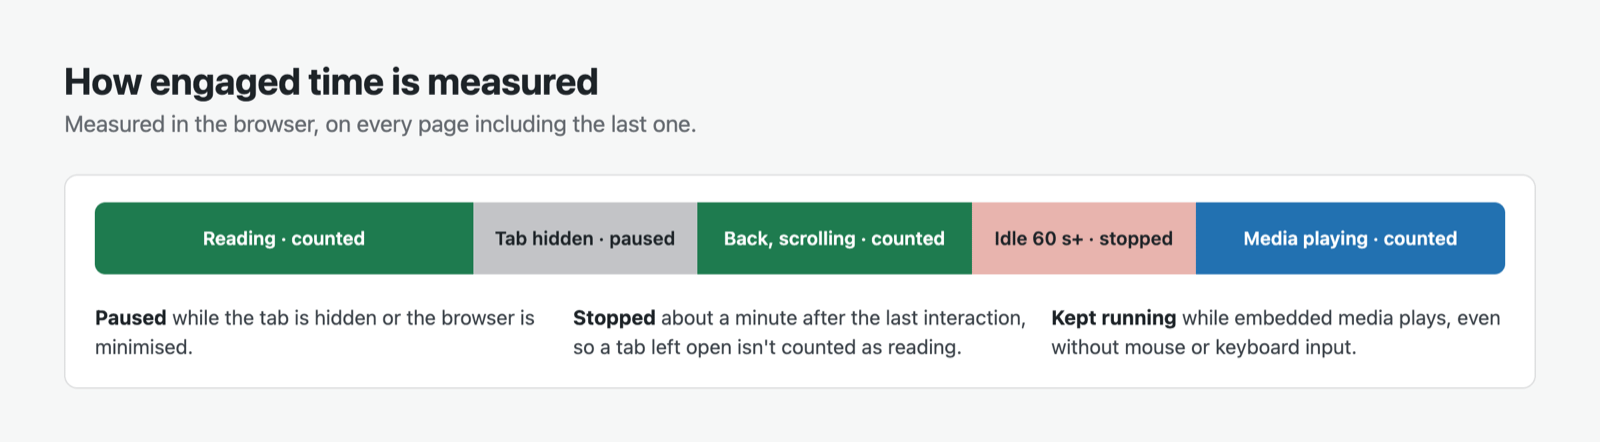
In practice, your engaged-time figures will typically be higher than gap-based tools report, and your bounce rate will be lower. GreenOrb can see engagement that gap-based timing misses.
6. Axis 3: Human Verification: Was a Real Person There?
This is the axis that does not exist in most analytics tools, and it is the one we point to first. Every session carries an input signal, shown right underneath its Engaged or Bounce badge:
| Signal | What it means |
|---|---|
| Real input | A genuine mouse movement, key press, scroll wheel, or touch was recorded. Strong evidence a person was present. |
| Media played | No input device, but embedded media played. Usually a real listener, because a tap inside a YouTube or SoundCloud player is invisible to the surrounding page. Playback can also be scripted, so it is reported separately. |
| No input signal | Neither was seen. Typical of automation. |

Read it alongside the engagement badge:
- Engaged + real input: A genuine, valuable visit.
- Bounce + no input: Almost certainly automated.
- Engaged + no input: The interesting one. Long engaged time with no human signal is the fingerprint of an automated browser holding a page open. On most dashboards, that session would be reported to you as the best visit of your week.
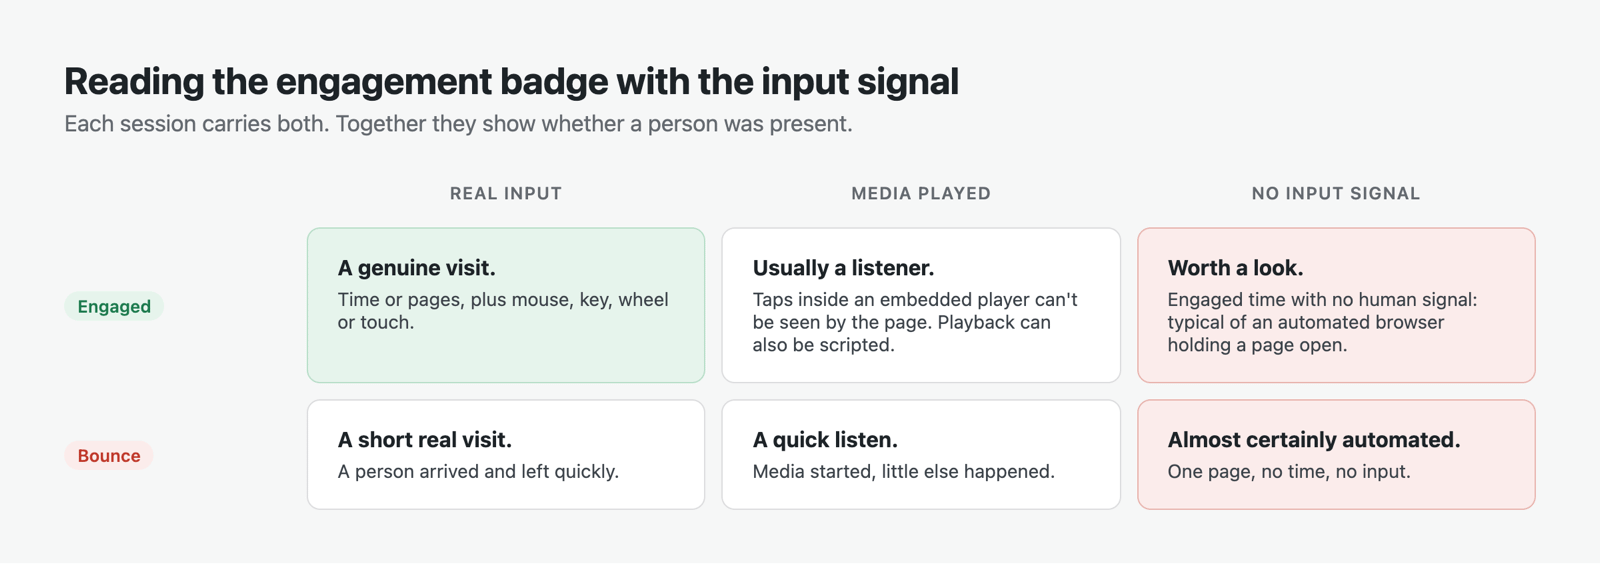
Three axes, and none of them can be faked into agreeing with the other two.
7. Cookie Banners, Bots, and the “Missing” Traffic
Two things wreck session data on sites running a consent plugin, and GreenOrb handles both.
When a visitor declines cookies, GreenOrb, in its default anonymous mode, keeps counting them cookielessly, with no identifier stored. Your sessions do not disappear; they stay real, just less identifiable. If you would rather a refusal meant nothing is recorded at all, switch to strict mode; that is your choice, and it is a setting. When somebody accepts the banner partway through a visit, their identity is stitched rather than split, keeping one visit as one visit.

Regarding bots: automation that executes JavaScript looks exactly like a person to most tracking scripts. GreenOrb filters the obvious cases before they reach your reports (declared crawlers, headless browsers, hit floods). It then catches the polite impostors by their behaviour: one page, no interaction, no input signal.
Flagged visitors are badged with the reason, not silently deleted. You can look at the evidence and overrule it. It is your site.

8. Why Your Numbers Might Look Lower (And Why That’s Good)
All of this has a consequence you should expect: if you run GreenOrb next to another tool, GreenOrb will usually report fewer sessions.
The instinct is to assume something is being missed. Almost always, the opposite is true: the other tool is counting traffic that isn’t made of people.
Because of this, our numbers come with a receipt. The Bot Filtering report itemises every hit that was rejected and why. Your privacy choices (Do Not Track, declined consent, logged-in team, excluded IPs) are kept in a separate category, because respecting a privacy choice is not the same thing as blocking a bot.


If you are comparing two dashboards side by side, the gap between them should look a lot like that filtered total. That is the traffic in dispute, listed line by line.
Why the Rules Are Published
A metric you cannot audit is a metric you cannot act on. If “engaged” has no published definition, a change in your engagement rate tells you nothing. You cannot tell whether your readers changed or the rule did.
Every threshold is documented and adjustable, and every hit the plugin rejects is itemised on screen. Your sessions number is still a reconstruction, but now you can check how it was built.
Frequently Asked Questions
Why does GreenOrb use a 30-minute timeout if it critiques traditional analytics?
We use the 30-minute window because it is the industry standard. A metric that disagrees with every other tool about basic session timeouts creates unnecessary confusion. We critique how time and engagement are measured within that session, not the baseline definition of the session itself.
Why is my bounce rate lower in GreenOrb than in my previous analytics plugin?
If your previous tool worked out time by subtracting one page load from the next, as many page-view-based trackers do, a visitor who read your page for ten minutes and left was recorded as zero seconds and a bounce. GreenOrb measures actual visible, active time in the browser. If they were actually engaged, it counts as engaged, which lowers your bounce rate for the right reason.
What happens if a visitor declines my cookie banner?
That depends on a choice you make. In the default anonymous mode, GreenOrb still counts the session cookielessly, with no identifier stored, so your data reflects actual traffic rather than just consent rates. In strict mode, a refusal means nothing is recorded at all.
How does GreenOrb handle embedded media like YouTube or SoundCloud?
If a user is listening to a track, the engaged time clock keeps running, even if they aren’t moving their mouse. However, because clicks inside embedded iframes are invisible to the host page, we categorise this under the “Media played” input signal rather than “Real input”. Playback can also be scripted, so we keep it separate rather than pretend it proves a person was there.
Can I change the thresholds for what counts as an “Engaged” session?
Yes. The thresholds (2 or more distinct pages, 15 or more seconds, 50% scroll plus dwell time) are adjustable with WordPress filters: a short code snippet rather than a control on a settings screen. That is deliberate: these thresholds define what your historical numbers mean, so they should not be nudged casually.
Screenshots are from a demonstration site running GreenOrb Statistics with test data. Every figure in them was calculated by the plugin; none has been edited.
Want the full technical detail? See Sessions for the complete screen breakdown, Understanding your metrics for exact calculation methods, and Why your numbers may look lower than other plugins for the full filtering picture.



0 Comments